In the bustling realm of e-commerce, where the digital marketplace is both dynamic and fiercely competitive, gaining actionable insights through website analytics is the cornerstone of success.
Understanding the intricate metrics that define user behaviors, interactions, and overall performance is a strategic imperative for businesses aiming to thrive in the online retail landscape.
This exploration into website analytics metrics within the target vertical of e-commerce seeks to unravel the vital indicators that illuminate the path to success.
From conversion rates that speak to the efficacy of online strategies to the nuanced journey of a customer navigating through the virtual aisles, this analysis is dedicated to shedding light on the metrics that empower e-commerce enterprises to refine their strategies, enhance user experiences, and ultimately, triumph in the digital marketplace.
Join us in uncovering the data-driven insights that propel e-commerce businesses to new heights of performance and customer satisfaction.
What are the different Web Analytics Metrics for Ecommerce
Here are different website analytics metrics for Ecommerce
1. Conversion Rate
Conversion Rate is a pivotal metric in e-commerce, reflecting the effectiveness of a website in turning visitors into customers.
Here’s a more detailed explanation:
Definition:
Conversion Rate is the percentage of website visitors who complete a desired action, which could be making a purchase, signing up for a newsletter, or filling out a form. In the context of e-commerce, the primary focus is typically on the percentage of visitors who make a purchase.
Calculation:
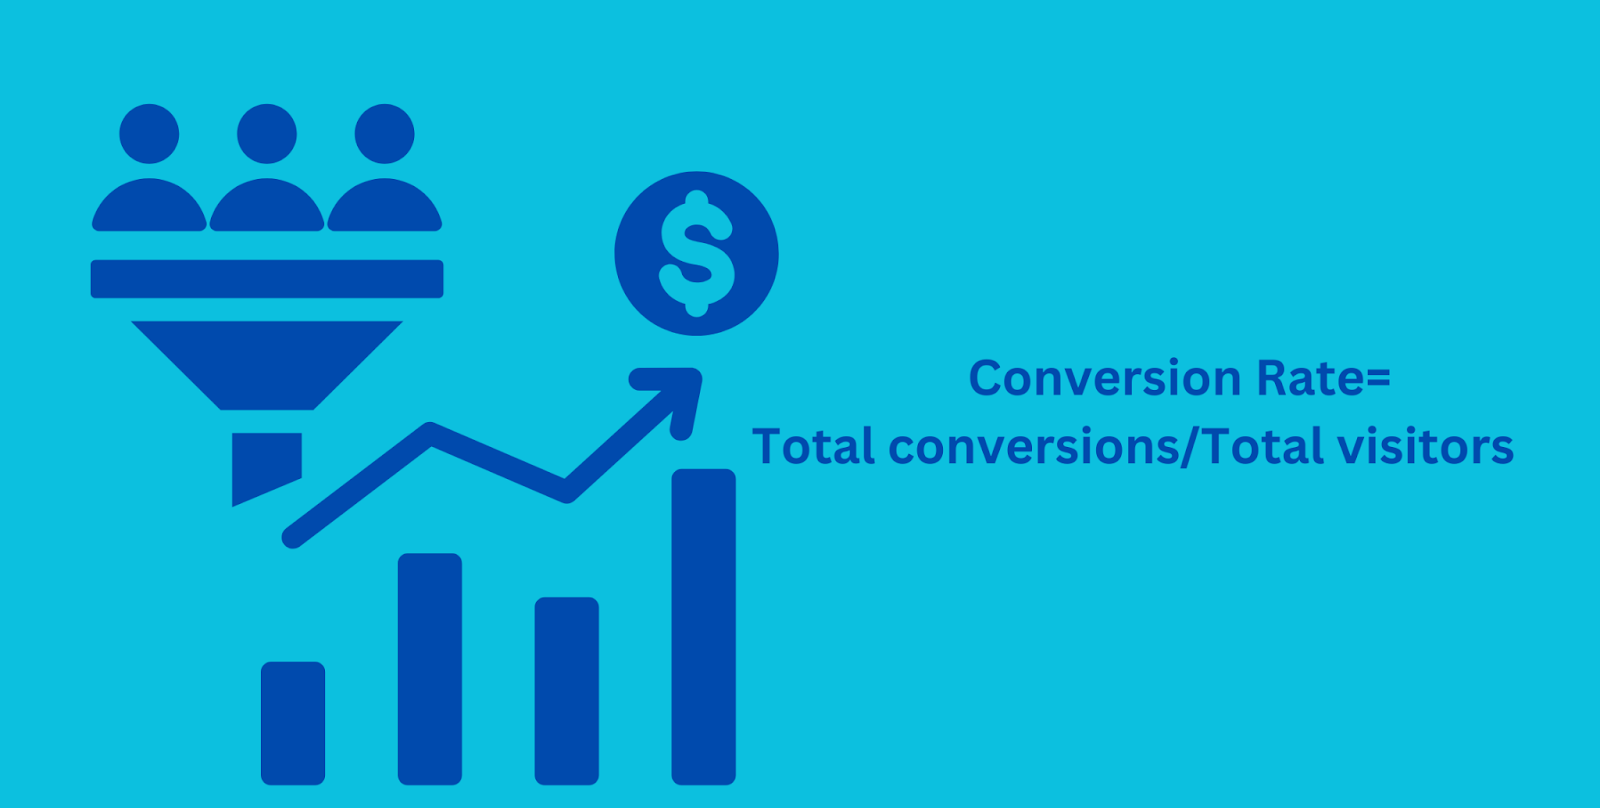
The formula for calculating Conversion Rate is:
|
Conversion Rate= Total conversions/Total visitors |
Importance:
- Business Performance Indicator: A high conversion rate indicates that a significant portion of website visitors is taking the desired action, contributing to revenue generation.
- User Experience Evaluation: A low conversion rate may suggest issues with the website’s user experience, checkout process, or overall design that need attention.
- Marketing Effectiveness: Conversion Rate is a key metric for evaluating the success of marketing campaigns. It helps assess how well the targeted audience responds to advertisements or promotions.
- Optimization Focus: By analyzing Conversion Rate, businesses can identify areas for improvement, such as optimizing product pages, simplifying the checkout process, or enhancing trust-building elements.
Factors Influencing Conversion Rate:
- Website Design and Navigation:
An intuitive and visually appealing website can positively impact conversion rates.
- Product Presentation:
Clear product images, detailed descriptions, and persuasive copy contribute to a higher likelihood of conversion.
- Checkout Process:
A streamlined, user-friendly checkout process with multiple payment options can reduce cart abandonment and boost conversions.
- Trust and Security:
Displaying trust signals, such as secure payment icons and customer reviews, instills confidence in visitors.
- Responsive Design:
Ensuring the website is optimized for various devices enhances the user experience, positively affecting conversion rates.
- Monitoring and Optimization:
Regularly monitor Conversion Rate and conduct A/B testing to experiment with different elements on your website. Test variations in product descriptions, call-to-action buttons, or checkout processes to identify what resonates best with your audience.
Related: https://www.analyticodigital.com/blog/why-conversion-rate-dropping-10-reasons
2. CLTV
Customer Lifetime Value (CLTV or CLV) is a metric that estimates the total revenue a business can expect from a customer throughout their entire relationship. It is a crucial metric for understanding the long-term value of a customer to a business.
Here’s a breakdown:
Calculation:
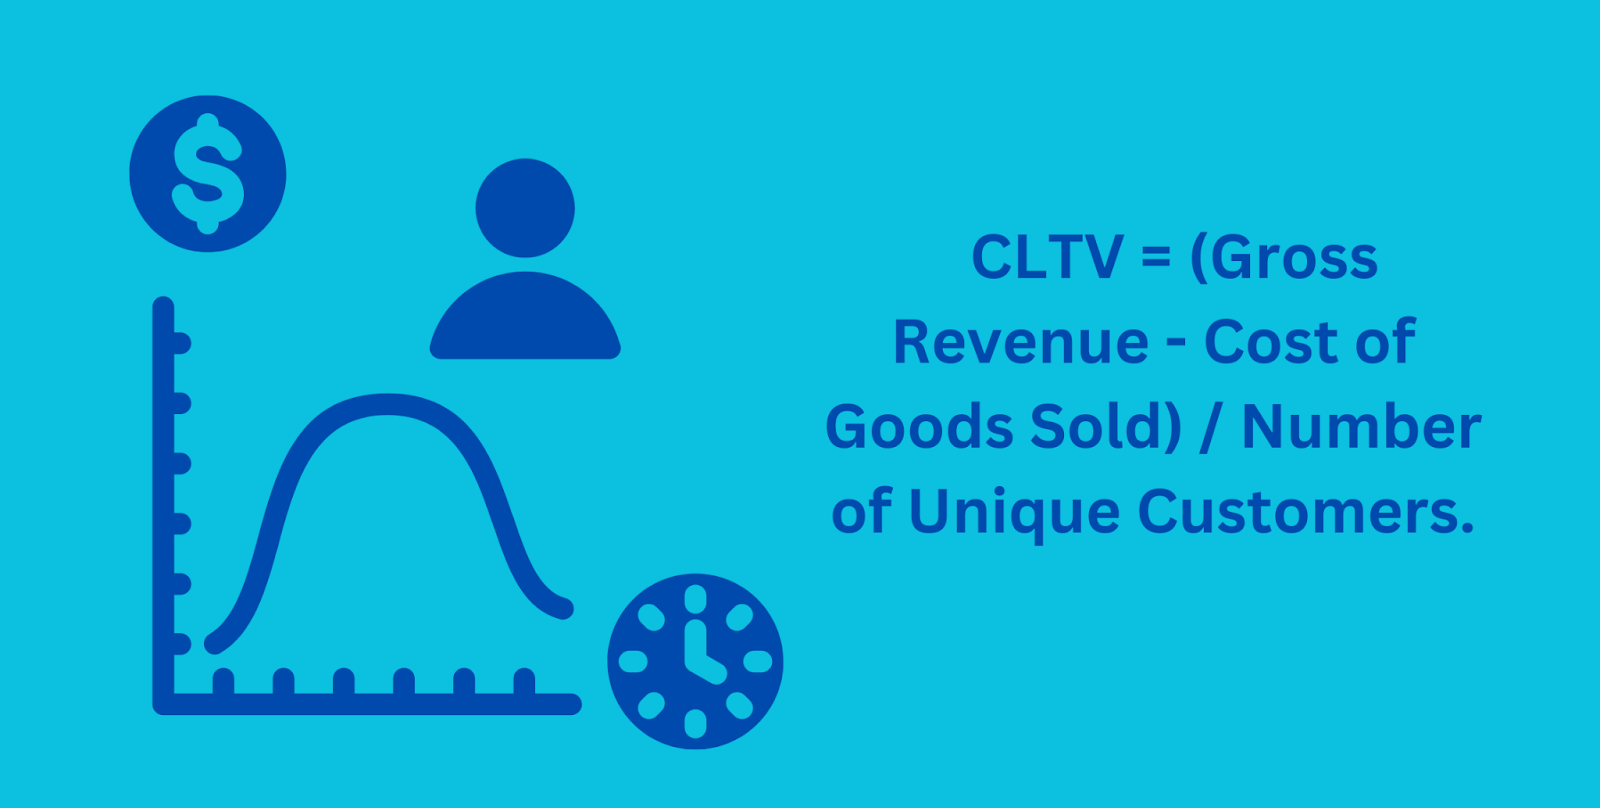
The formula for calculating CLTV is:
|
CLTV = (Gross Revenue - Cost of Goods Sold) / Number of Unique Customers. |
- Average Purchase Value: The average amount a customer spends in a single transaction.
- Purchase Frequency: How often a customer makes a purchase in a given period.
- Customer Lifespan: The average duration a customer continues to make purchases from the business.
Importance:
- Strategic Decision-Making: CLTV guides strategic decisions by helping businesses allocate resources more effectively, especially in marketing and customer acquisition.
- Customer Segmentation: It aids in segmenting customers based on their value, allowing businesses to tailor marketing strategies for different customer segments.
- Profitability Assessment: Businesses can assess the profitability of acquiring and retaining customers by comparing CLTV with the cost of customer acquisition (CAC).
- Focus on Retention: CLTV highlights the importance of customer retention, as extending the customer lifespan can significantly impact overall revenue.
Factors Influencing CLTV:
- Customer Retention: Keeping customers engaged and loyal over an extended period is a key driver of CLTV.
- Cross-Selling and Upselling: Encouraging customers to buy more or upgrade their purchases increases both average purchase value and CLTV.
- Customer Satisfaction: Satisfied customers are more likely to make repeat purchases and contribute positively to CLTV.
- Quality of Products/Services: Providing high-quality products or services contributes to customer satisfaction and, consequently, higher CLTV.
Application:
- Marketing Budget Allocation: CLTV helps in determining how much a business can afford to spend on acquiring a new customer.
- Product Development: Understanding CLTV can guide decisions related to product development and enhancements that cater to the needs of high-value customers.
- Customer Loyalty Programs: CLTV insights can inform the design and effectiveness of customer loyalty programs.
In essence, CLTV is a forward-looking metric that provides businesses with insights into the long-term revenue potential of their customer base, enabling more informed decision-making and strategic planning.
3.AOV
Average Order Value (AOV) is a crucial e-commerce metric that represents the average amount of money a customer spends on each order.
Calculated by dividing the total revenue by the number of orders, AOV provides insights into customer purchasing behavior and contributes to strategic decision-making.
Here’s a breakdown:
Calculation:
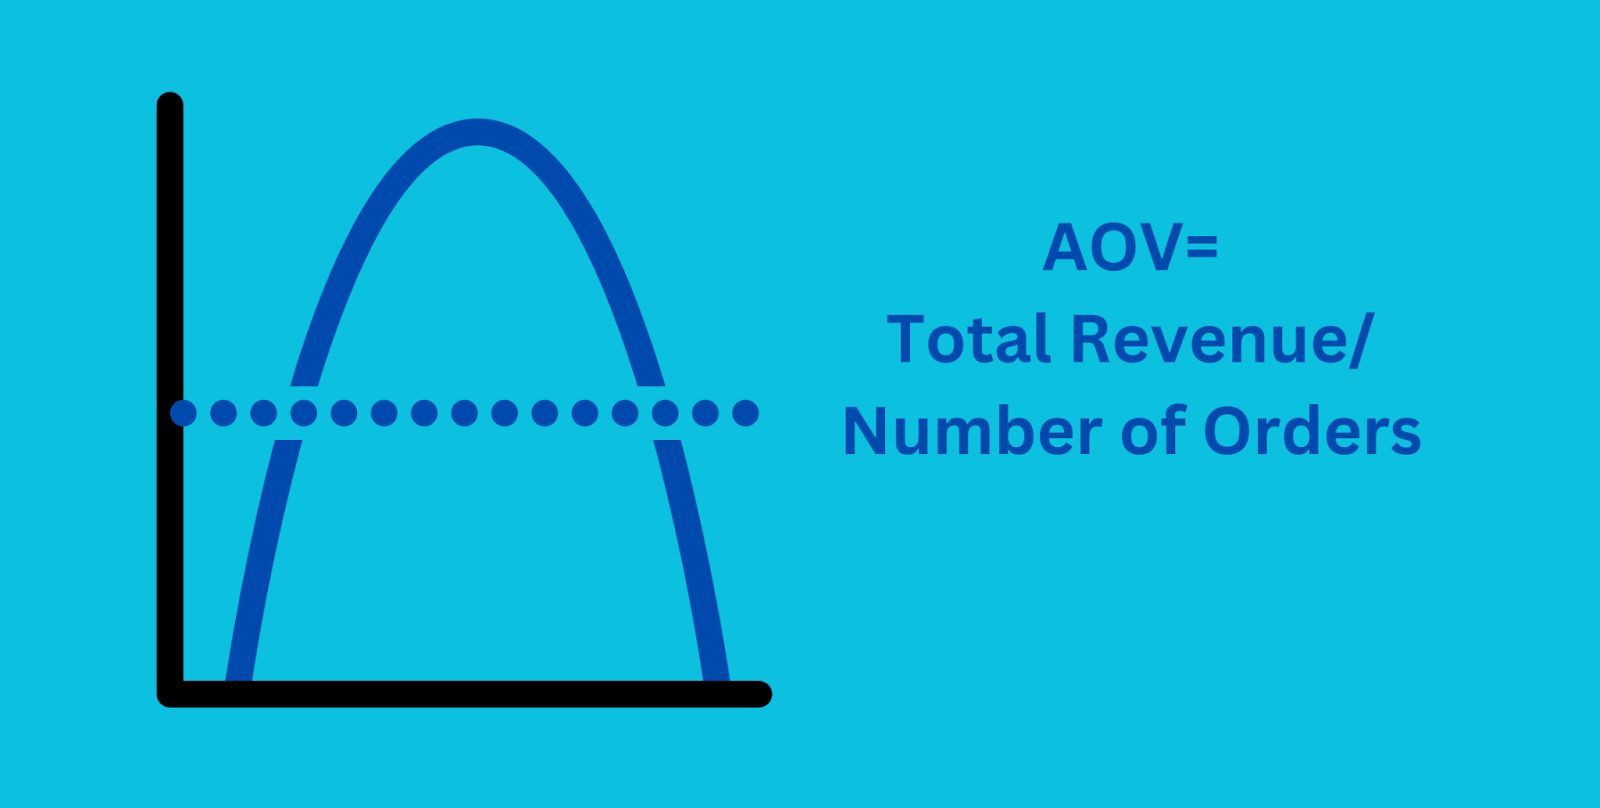
The formula for calculating AOV is:
|
AOV=Total Revenue/ Number of Orders |
Importance:
- Revenue Analysis: AOV helps businesses understand the typical spending behavior of their customers, contributing to revenue forecasting.
- Marketing Strategies: AOV insights guide marketing strategies, such as setting minimum order values for promotions or free shipping thresholds.
- Cross-Selling and Upselling: Encouraging customers to add more items to their cart or upgrade their purchases can positively impact AOV.
- Inventory Management: AOV influences inventory decisions by identifying popular and high-value products.
Factors Influencing AOV:
- Product Bundling: Offering product bundles or packages can increase the total value of each order.
- Cross-Selling and Upselling: Suggesting complementary or higher-priced items during the shopping process can boost AOV.
- Discounts and Promotions: Strategic use of discounts or promotions may encourage customers to spend more.
- Customer Segmentation: AOV can vary across different customer segments, helping businesses tailor strategies accordingly.
Application:
- Profitability Assessment: AOV contributes to assessing the overall profitability of a business by understanding the average value of each transaction.
- Marketing Campaigns: AOV insights guide the planning and execution of marketing campaigns, allowing businesses to set realistic revenue targets.
- Website Optimization: Understanding AOV helps optimize the website experience to encourage higher-value purchases.
- Customer Relationship Management: AOV contributes to customer segmentation strategies, allowing businesses to personalize their approach based on spending patterns.
In summary, Average Order Value is a valuable metric that provides actionable insights into customer spending behavior, allowing businesses to optimize strategies for increased revenue and profitability.
4. Cart Abandonment
Cart abandonment occurs when online shoppers add items to their shopping cart but leave the website without completing the purchase. It’s a common challenge in e-commerce, and understanding and addressing the reasons behind it are crucial.
Here’s a breakdown:
Causes
- Unexpected Costs: Additional costs like shipping fees or taxes that appear late in the checkout process can deter customers.
- Complicated Checkout Process: A lengthy or complicated checkout process may frustrate users, leading to abandonment.
- Lack of Trust: Concerns about the security of personal and financial information can discourage users from completing a purchase.
- Price Comparison: Shoppers often compare prices across different platforms, leading to cart abandonment if they find a better deal elsewhere.
- Technical Issues: Glitches, errors, or a slow website can frustrate users and prompt them to abandon their carts.
Reducing Cart Abandonment:
- Transparent Pricing: Clearly display all costs, including shipping fees and taxes, early in the shopping process.
- Streamlined Checkout: Simplify the checkout process by minimizing form fields and providing guest checkout options.
- Trust Signals: Display trust badges, secure payment icons, and customer testimonials to build trust.
- Remarketing Strategies: Implement remarketing campaigns to re-engage users who abandoned their carts, reminding them of their items.
- Exit-Intent Pop-ups: Use exit-intent pop-ups to offer discounts or incentives as users attempt to leave the website.
Metrics to Monitor:
- Cart Abandonment Rate: Calculated by dividing the number of abandoned carts by the number of initiated checkouts.
- Reasons for Abandonment: Analyze customer feedback, conduct surveys, or use analytics tools to understand specific reasons for cart abandonment.
- Ongoing Optimization:
Regularly analyze cart abandonment data, implement A/B testing, and continuously optimize the checkout process based on customer feedback to reduce abandonment rates over time.
In conclusion, addressing the causes of cart abandonment requires a holistic approach, including transparent pricing, a user-friendly checkout process, and trust-building strategies to create a more seamless online shopping experience.
5. Bounce Rate
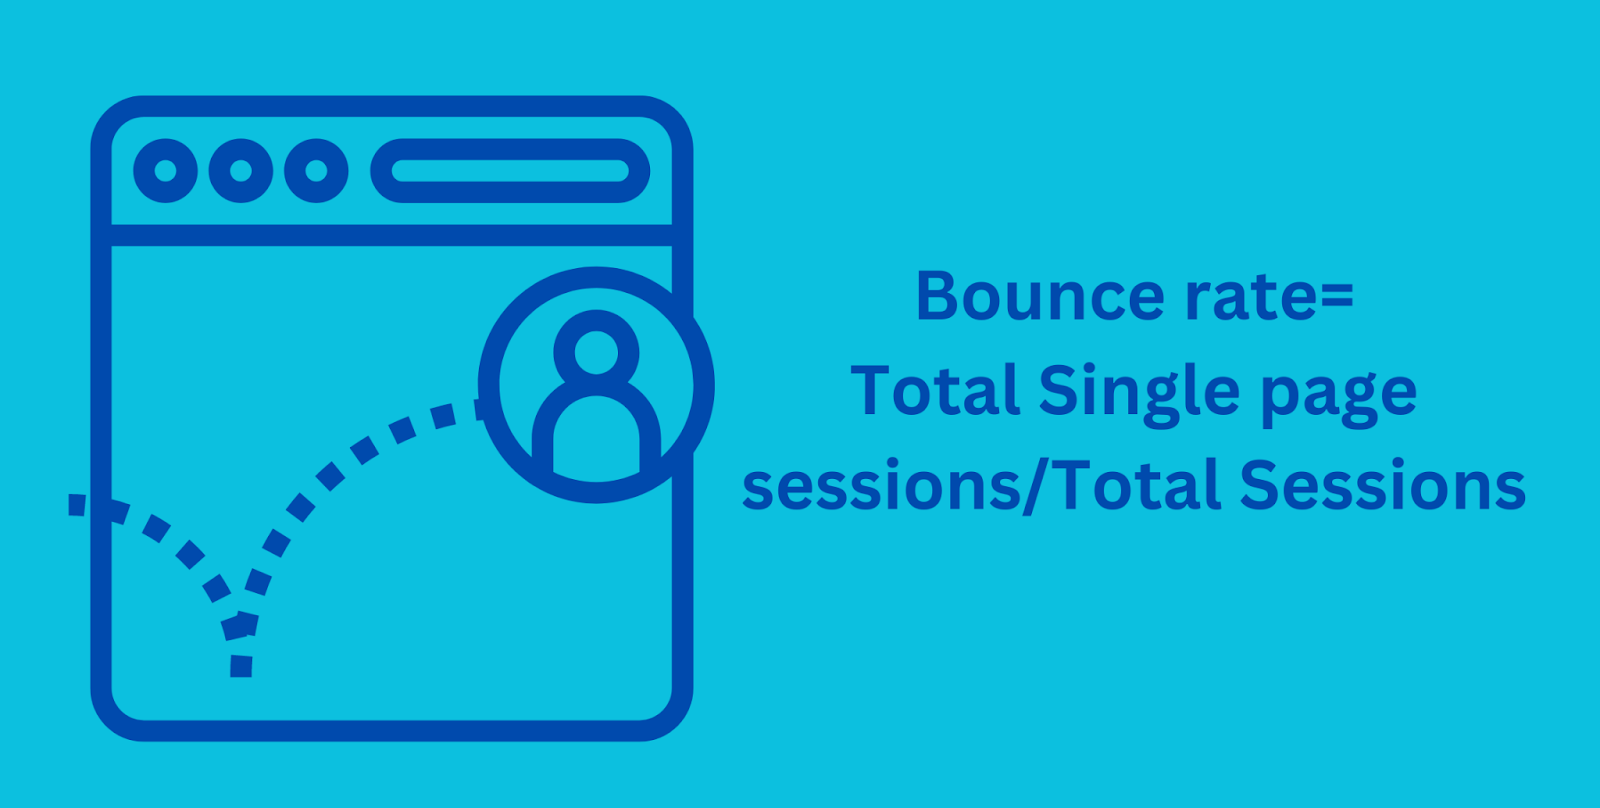
Bounce Rate is a web analytics metric that measures the percentage of visitors who navigate away from a website after viewing only one page. A high bounce rate can indicate that visitors are not finding what they expected or that the initial landing page did not engage them effectively.
Here’s more insight into this metric:
Calculation:
|
Bounce rate= Total Single page sessions/Total Sessions |
Interpretation:
- A high bounce rate (typically above 70%) may suggest issues with the landing page, content relevance, or overall user experience.
Factors Influencing Bounce Rate:
- Page Relevance: If the landing page content does not match user expectations or is not relevant, visitors are more likely to bounce.
- Load Time: Slow-loading pages can lead to higher bounce rates as users may abandon the site if it takes too long to load.
- User Experience: A poor website design or difficult navigation can contribute to a higher bounce rate.
- Mobile Optimization: A lack of mobile responsiveness may lead mobile users to leave quickly.
- Content Quality: Low-quality content, including unclear or uninteresting information, can drive visitors away.
Reducing Bounce Rate:
- Optimize Landing Pages: Ensure that landing pages are relevant, engaging, and provide the information users are seeking.
- Improve Page Load Speed: Optimize images, use caching, and employ other techniques to enhance page load times.
- Enhance User Experience: Make navigation intuitive and ensure a seamless user experience across devices.
- Mobile Optimization: Prioritize mobile responsiveness to cater to users accessing the site from various devices.
- Clear Call-to-Action (CTA): Encourage users to explore further with clear and compelling CTAs.
Monitoring and Analysis:
Regularly monitor bounce rates and use analytics tools to drill down into specific pages or traffic sources with high bounce rates. This analysis helps identify areas for improvement and optimization.
In summary, a bounce rate provides valuable insights into the initial user interaction with a website. Reducing bounce rates often involves improving page relevance, optimizing performance, and enhancing the overall user experience.
6.Pages Per session

Pages Per Session is a web analytics metric that measures the average number of pages a visitor views during a single session on a website. It provides insights into user engagement and the effectiveness of the website in encouraging visitors to explore multiple pages.
Here’s a breakdown:
Calculation:
|
Pages Per Session= Total Number of Page Views/ total number of sessions |
Interpretation:
- A higher Pages Per Session value indicates that, on average, visitors are exploring more pages during their sessions.
Factors Influencing Pages Per Session:
- Content Quality: Engaging and relevant content encourages users to explore more pages.
- Site Navigation: Intuitive navigation and clear pathways to related content contribute to higher page views.
- Internal Linking: Well-placed internal links guide users to additional pages, increasing the likelihood of more views.
- Calls-to-Action (CTAs): Effective CTAs prompt users to explore further, contributing to increased page views.
- User Experience: A positive overall user experience, including fast page load times, can lead to more extensive exploration.
Improving Pages Per Session:
- Content Strategy: Create compelling and informative content that encourages users to navigate to other pages.
- Internal Linking: Strategically place internal links within content to guide users to related articles or products.
- Related Content Suggestions: Provide suggestions for related content to keep users engaged and interested.
- Clear Navigation: Ensure that the website has clear navigation menus and pathways to help users discover more content.
- Interactive Elements: Incorporate interactive elements, such as quizzes, polls, or multimedia, to captivate visitors and encourage further exploration.
Monitoring and Analysis:
Regularly monitor Pages Per Session and use analytics tools to identify patterns, such as which pages contribute most to multiple-page views. This analysis helps refine content strategies and user experience to improve engagement.
In summary, Pages Per Session is a valuable metric for assessing user engagement on a website. By focusing on content quality, navigation, and user experience, businesses can encourage visitors to explore more pages, fostering a deeper connection with the site.
7. Session Duration
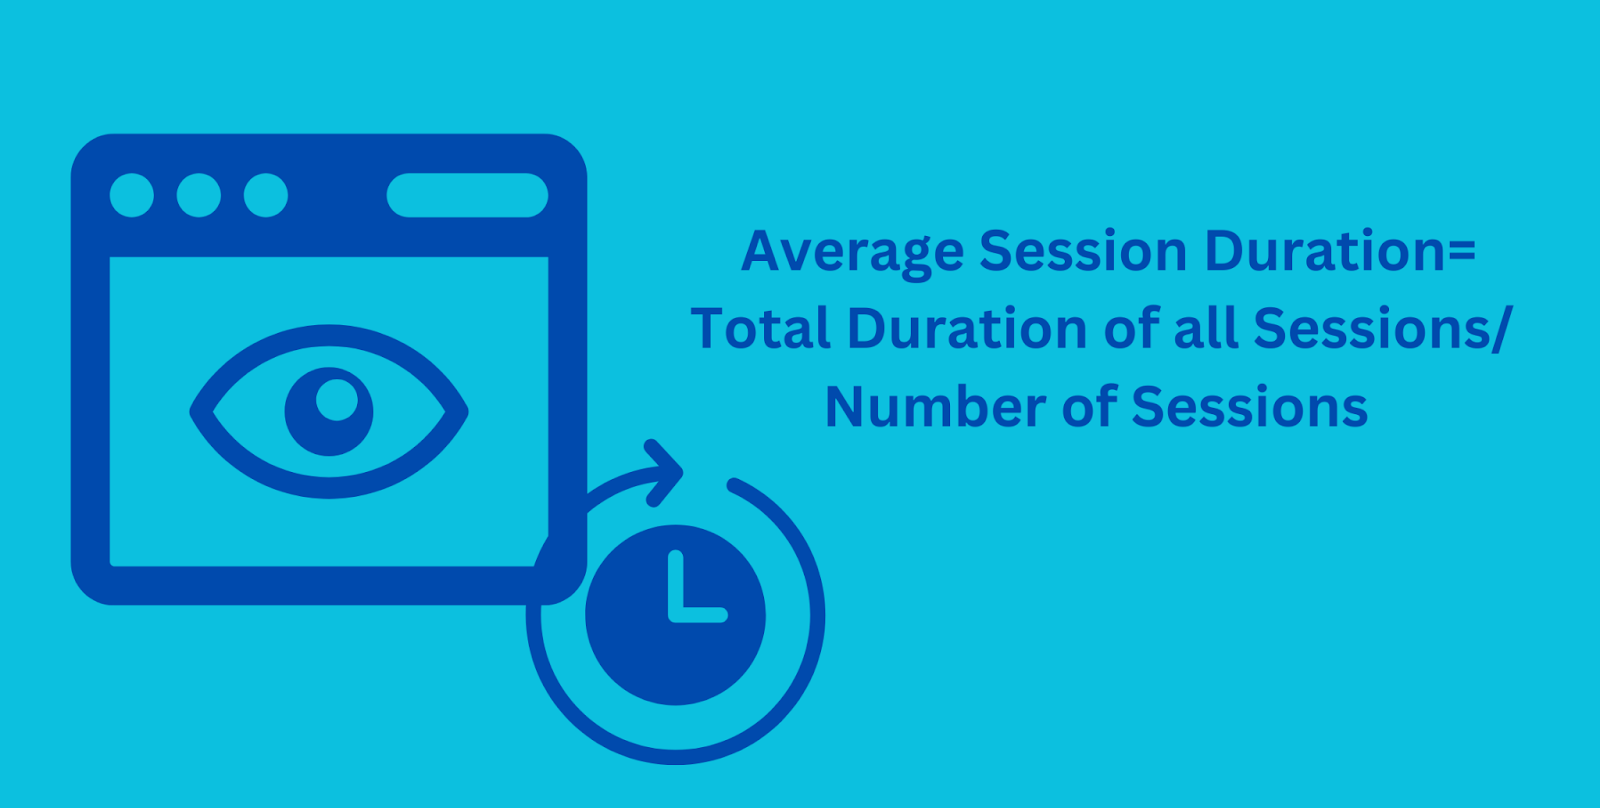
Session Duration, in web analytics, measures the amount of time a user spends on a website during a single visit or session. It provides insights into user engagement and the overall stickiness of the website.
Here’s a breakdown:
Calculation:
|
Average session duration= Total duration of all sessions/ Number of sessions |
Interpretation:
- A higher session duration generally indicates that users are spending more time engaged with the content on the website.
Factors Influencing Session Duration:
- Content Relevance: High-quality and relevant content tends to keep users engaged for longer periods.
- Page Load Speed: Faster page load times contribute to a positive user experience and may result in longer session durations.
- User Intent: Understanding and meeting user intent with valuable content can lead to prolonged sessions.
- Interactivity: Interactive elements, such as videos, quizzes, or other engaging features, can extend session durations.
- Site Navigation: An intuitive and easy-to-navigate website structure encourages users to explore more, extending session duration.
Improving Session Duration:
- Quality Content: Create informative, engaging, and relevant content that holds users’ interest.
- Multimedia Integration: Incorporate multimedia elements like videos, images, or interactive tools to enhance engagement.
- Internal Linking: Guide users to other relevant pages through well-placed internal links within your content.
- Clear Calls-to-Action (CTAs): Encourage users to explore further with clear and compelling CTAs.
- Optimize User Experience: Ensure a smooth and intuitive user experience, from navigation to mobile responsiveness.
Monitoring and Analysis:
Regularly monitor session duration trends and use analytics tools to identify pages or content types that contribute to longer sessions. This analysis helps refine content strategies and optimize user experience to increase overall engagement.
In summary, Session Duration is a key metric for gauging user engagement on a website. By focusing on content quality, interactivity, and user experience, businesses can work towards increasing the time users spend on their site, fostering a more meaningful connection with the audience.
8. New VS Returning Customers

Distinguishing between new and returning customers is essential for understanding customer acquisition, retention strategies, and overall business growth.
Here’s a breakdown of the differences:
New Customers:
- Definition: New customers are individuals who make their first purchase or engage with a business for the first time during a specific period.
- Acquisition Focus: Businesses often allocate resources and marketing efforts towards acquiring new customers to expand their customer base.
- Conversion Funnel: New customers typically enter the conversion funnel at the awareness or consideration stage.
- Marketing Strategies: Marketing strategies for new customers often involve reaching wider audiences, highlighting products/services, and creating a positive first impression.
Returning Customers:
- Definition: Returning customers are individuals who have made a purchase or engaged with a business previously and return for additional transactions or interactions.
- Retention Focus: Retaining existing customers is crucial for businesses as returning customers often contribute significantly to revenue.
- Conversion Funnel: Returning customers are likely to be further down the conversion funnel, having already experienced the brand and its offerings.
- Marketing Strategies: Marketing efforts for returning customers often include loyalty programs, personalized offers, and retargeting to enhance the overall customer experience.
Key Metrics for Analysis:
- Customer Lifetime Value (CLTV): Both new and returning customer segments contribute to CLTV, providing a holistic view of a customer’s value over time.
- Customer Acquisition Cost (CAC): Analyzing CAC for new customers and comparing it with CLTV helps assess the efficiency of acquisition strategies.
- Retention Rate: Monitoring the percentage of customers who return helps gauge the success of retention efforts.
- Conversion Rates: Comparing conversion rates between new and returning customers provides insights into the effectiveness of marketing and engagement strategies.
Strategic Considerations:
- Balanced Approach: While acquiring new customers is essential for growth, businesses should also focus on building strong relationships with existing customers to encourage repeat business.
- Personalization: Personalized communication and offers can enhance the customer experience for both new and returning customers.
- Feedback Utilization: Gather feedback from both segments to continuously improve products, services, and the overall customer journey.
In summary, understanding the dynamics between new and returning customers is crucial for developing a comprehensive business strategy that balances acquisition and retention efforts to drive sustainable growth.
9. Checkout Funnel Analysis
Checkout funnel analysis is a critical aspect of e-commerce analytics that involves examining the steps users take during the checkout process. It helps identify points of friction, dropout rates, and opportunities for optimization.
Here’s how to conduct a checkout funnel analysis:
- Define Checkout Funnel Steps:
Identify the key steps in your checkout process, starting from the cart to the final confirmation page. Common steps include cart view, login or guest checkout, shipping information, payment details, and order confirmation.
- Set Up Analytics:
Use web analytics tools (e.g., Google Analytics) to track user interactions at each step of the checkout funnel. Set up goals and events to monitor conversions and user behavior.
- Analyze Funnel Metrics:
Examine the following metrics at each stage of the checkout funnel:
- Cart Abandonment Rate: Calculate the percentage of users who add items to their cart but do not complete the purchase.
- Step-to-Step Conversion Rates: Measure the percentage of users progressing from one step to the next in the checkout process.
- Average Time Spent per Step: Evaluate how much time users spend on each checkout step to identify potential points of confusion or hesitation.
- Exit Rates: Identify the pages where users are most likely to exit the checkout process.
- Identify Points of Friction:
Look for potential issues causing users to abandon the checkout process. Common friction points include unexpected costs, complex forms, lack of payment options, or concerns about security.
- Optimize User Experience:
Implement improvements based on your analysis:
- Simplify Forms: Minimize the number of form fields and make the process as straightforward as possible.
- Transparent Pricing: Clearly communicate all costs, including taxes and shipping, early in the process.
- Guest Checkout Option: Offer a guest checkout option to streamline the process for first-time buyers.
- Progress Indicators: Provide clear progress indicators to show users how far they are in the checkout process.
- A/B Testing:
Conduct A/B testing to experiment with variations in your checkout process. Test changes to form layouts, button colors, or other elements to identify what resonates best with your audience.
- Monitor and Iterate:
Regularly monitor the updated checkout funnel and iterate based on ongoing data analysis. User behavior and expectations may evolve, so continuous optimization is crucial.
By systematically analyzing and optimizing the checkout funnel, businesses can enhance the overall user experience, reduce abandonment rates, and improve conversion rates, ultimately driving more successful transactions.
10. Mobile Traffic and Conversions
Analyzing mobile traffic and conversions is crucial for understanding user behavior on mobile devices and optimizing the mobile user experience. Here’s how you can approach this analysis:
Mobile Traffic Overview:
- Mobile Traffic Share: Determine the percentage of overall website traffic coming from mobile devices.
- Device Breakdown: Analyze which specific mobile devices (smartphones, tablets) contribute to the mobile traffic.
Mobile Conversion Rates:
- Conversion Rate by Device: Compare conversion rates between mobile devices to identify if there are variations in user behavior.
- Benchmark with Desktop: Compare mobile conversion rates with desktop conversion rates to understand how well your website performs on different devices.
User Journey Analysis:
- Mobile User Behavior: Use analytics tools to track the user journey on mobile devices, including the pages they visit and the actions they take.
- Mobile Path Analysis: Identify common paths users take on mobile, from entry to conversion or exit.
Page Performance:
- Mobile Page Load Speed: Evaluate the loading speed of your mobile pages. Slow load times can negatively impact user experience and conversions.
- Mobile Responsiveness: Ensure that your website is fully responsive and provides a seamless experience across various screen sizes.
Mobile-Focused Content:
- Content Optimization: Adapt content for mobile users, ensuring readability and engagement on smaller screens.
- Call-to-Action (CTA) Visibility: Ensure that CTAs are prominently displayed and easy to interact with on mobile devices.
Checkout Process Optimization:
- Mobile-Friendly Checkout: Simplify the checkout process for mobile users, reducing the number of steps and optimizing form fields.
- Mobile Payment Options: Offer mobile-friendly payment options and consider digital wallets for smoother transactions.
Mobile Advertising Impact:
- Mobile Ad Performance: Evaluate the effectiveness of mobile advertising campaigns in driving traffic and conversions.
- Cross-Device Analysis: Understand if users interact with ads on mobile devices but convert on desktop or vice versa.
A/B Testing on Mobile:
- Mobile-Specific Testing: Conduct A/B testing specifically on mobile versions of your website to identify design or content elements that resonate best with mobile users.
Mobile App (if applicable):
- App Engagement: If you have a mobile app, analyze user engagement and conversion rates within the app.
- App vs. Mobile Web Comparison: Compare the performance of your app with the mobile web version to determine where users prefer to engage.
Continuous Monitoring and Iteration:
- Regular Analysis: Regularly analyze mobile traffic and conversion data to identify trends and areas for improvement.
- Feedback Mechanisms: Utilize user feedback and reviews to understand their mobile experience and make necessary adjustments.
By focusing on mobile traffic and conversions, businesses can tailor their strategies to meet the unique needs and preferences of mobile users, ultimately enhancing the overall digital performance.
Found this helpful? Check out more interesting articles from our blog.