
Are you still contemplating B2B digital marketing? It's time to shift gears and level up the game. Investing in it is not just an option; it's the game-changer your business needs. Do you want to learn some B2B dashboard tactics to keep track of your business performance? Then this blog is for you.
According to Statista, In 2023, B2B spending on marketing technology in the United States is expected to exceed $7.4 billion, showing a 12.4% increase from the previous year's $6.6 billion.
The forecast suggests a further rise of nearly 15%, reaching over $8.5 billion in 2024. So spending on it will help you in your future.
In this blog post, we delve into the concept of B2B marketing dashboards, offering insights on their utilization, and essential best practices to consider while creating a B2B marketing dashboard.
What is a B2B marketing dashboard?
B2B Marketing dashboards are powerful tools that visually display data from diverse sources, including website analytics, social media, sales, and finance.

Serving as a centralized hub, they establish benchmarks, track trends, and highlight the effectiveness of marketing strategies.
These dashboards are crucial for quick analysis, aiding in optimizing efforts and driving continuous improvement.

If you have any queries about Analytico's digital analytics services, get in touch to let our team of highly professional experts take care of your concerns.
|
FYI There's a diverse range of marketing dashboards tailored to specific needs: Digital Marketing Dashboards Marketing Performance Dashboards Web Analytics Dashboards No matter your company's unique data tracking requirements, Don’t worry, there's a dashboard out there designed to work for you. |
Why to Create a B2B Digital Marketing Dashboard:
It is seen that most marketers 89% use key metrics to track their campaigns and make decisions. To streamline this process, consider using a marketing dashboard, especially if you deal with complex data regularly.

This tool helps manage tasks like email marketing, assess marketing ROI, and handle social media.
A good marketing dashboard organizes your data and prompts you to analyze the insights you've gathered. It allows you to test your ideas and provides actionable steps for improvement.
By incorporating a marketing dashboard into your routine, you gain a clear understanding of your efforts' return on investment (ROI), making it easier to hold team members accountable and oversee projects. It provides an overview of your campaign's performance over time, helping you stay on top of things.
Elements to Include in the B2B Digital Marketing Dashboard:
For the B2B marketing dashboard, you need to consider the target audience whether they are internal teams or external stakeholders like CMOs, and then tailor the dashboard elements accordingly.
For internal dashboards, which are meant for marketing teams, it is crucial to include granular, data-rich metrics that are easily interpretable. On the other hand, external dashboards are designed to provide a summarized view of business-critical results, suitable for presentation at a boardroom level.

When building a dashboard, it is essential to use various types of elements to present data in a comprehensible manner. These elements are:
|
Elements |
Features |
|
Metrics: |
It displays a single numerical value for a specific metric, such as the number of Pay Per Click PPC visits. |
|
Timeline: |
Illustrate the performance of one or multiple metrics over a specified period, offering insights into trends and changes over time, like sessions and pages per session. |
|
Geomap Element: |
Showcase the distribution of a metric across geographical areas, providing a visual representation, for example, of visits by country. |
|
Table Element: |
Present a set number of rows displaying a group of metrics, allowing for a detailed breakdown, such as the number of sessions and conversions per channel or keyword. |
|
Bar Element: |
Similar to pie charts but presented in a bar format, offering an alternative visualization method. |
Choosing the appropriate element depends on the nature of the metric and the intended communication with the team or management. Whether a single metric suffices or a detailed table is required, the goal is to effectively convey insights derived from the available data.
Metrics to Include in B2B Digital Marketing Dashboard:
Effective marketing dashboards play a pivotal role in driving insightful decision-making across various organizational levels.
If you want to learn more about B2B Web analytics Metrics, Click Here: https://www.analyticodigital.com/blog/b2b-web-analytics-metrics
To achieve this, it is crucial to incorporate the right key performance indicators (KPIs) that cover the spectrum from sales to senior management.
Here are the essential metric categories that your marketing dashboards should measure:
Consumption Metrics:
While some may dismiss consumption metrics as mere vanity metrics, they provide valuable insights into the performance of your content and messaging strategies.
Metrics such as
Traffic.
Bounce Rate.
Time on Site.
Average Pages Visit.
All offer a comprehensive view of how audiences engage with your content. Though not directly tied to revenue, these metrics guide prioritization and optimization efforts, contributing to all stages of the sales and marketing funnel.
Social Metrics:
Social metrics offer a glimpse into the sentiment and impact of your messaging. Metrics like
Growth & Reach.
Click-Through Rates from Social Media.
Engagement Rates.
Acquisition Reports.
These showcase how well your content resonates with the audience. High social engagement can indicate content value, but it's crucial to analyze sentiment to ensure positive engagement. Identify thought leaders or stakeholders from key accounts engaging with your content to leverage these relationships for broader reach.
Lead Generation Metrics:
Critical sales teams and lead generation metrics provide insights into the business-critical outcomes of marketing efforts.
These metrics encompass
The Number of Conversions (total and by channel).
Cost Per Conversion (total and by channel).
Conversion Rate of Leads.
First click/Last click/Assisted Conversions.
Understanding the role of each marketing channel in the customer journey, especially with attribution models, prevents underestimating the value of channels guiding customers to the final conversion.
Sales Metrics:
Ultimately, the bottom line for any business is revenue. Sales metrics answer the pivotal question of how much money marketing is generating.
Key metrics in this category include
Average Deal Size.
Lead-to-customer Conversion.
Lifetime Value (LTV).
Revenue Segmented by Channel and Date Period.
Return on Investment (ROI),
Return on Ad Spend (ROAS),
Customer Acquisition Cost (CAC).
These metrics offer a comprehensive financial overview, guiding strategic decisions for maximizing profitability.
SEO Metrics:
SEO metrics also play a pivotal role in any business. This metric encompasses
Keyword Rankings: It keeps track of the positions of your website for specific keywords in search engine results.
Organic Traffic: The number of visitors who reach your website through unpaid (organic) search results.
Backlink Profile: Analyze the quantity and quality of backlinks pointing to your website.
On-Page SEO Factors: Assessments of how well your pages are optimized for search engines.
These metrics collectively provide a comprehensive view of your B2B digital marketing performance and help guide strategic decisions to improve overall effectiveness.
|
Remember! Adjust the focus and depth of analysis based on your specific business objectives and industry nuances. |
How To Create a B2B Digital Marketing Dashboard:
Creating a powerful B2B marketing analytics dashboard for your brand involves strategic planning and execution.

Follow these streamlined steps for an effective B2B marketing analytics dashboard:
|
Remember! First, you have to Identify industry-specific and business-centric key performance indicators (KPIs) for tracking. Focus on essential metrics to avoid unnecessary data overload. |
Optimal Design:
Choose a clean, uncluttered design with ample white space for improved focus. Select appropriate chart types, such as line charts for single-variable measurements, pie charts for multiple similar data points, and area charts for diverse data sets.
Audience Consideration:
Tailor the dashboard to suit the needs of diverse users with varying roles. Highlight crucial data sets and ensure relevance and actionability. Incorporate familiar icons, graphics, and color-blind-friendly palettes.
Select Dashboard Software:
Choose a cloud-based dashboard software that integrates seamlessly with social media channels. Opt for a self-service model with the ability to generate reports, perform queries, and identify hidden data patterns. Ensure accessibility across various devices and easy embedding in different software applications.
Choose Data Sources:
Consolidate data from various marketing platforms, utilizing native integrations when possible for a unified view. Native integrations offer smoother connections and require less manual maintenance. If necessary, use APIs to connect data sources.
Dashboard Mapping:
Sketch a visual representation of your final dashboard layout, detailing the inclusion of different data sets. While not mandatory, this step can save time during the actual dashboard creation process.
|
Note! Crafting an engaging marketing analytics dashboard involves these concise steps, ensuring data-driven insights and informed decision-making for your business. |
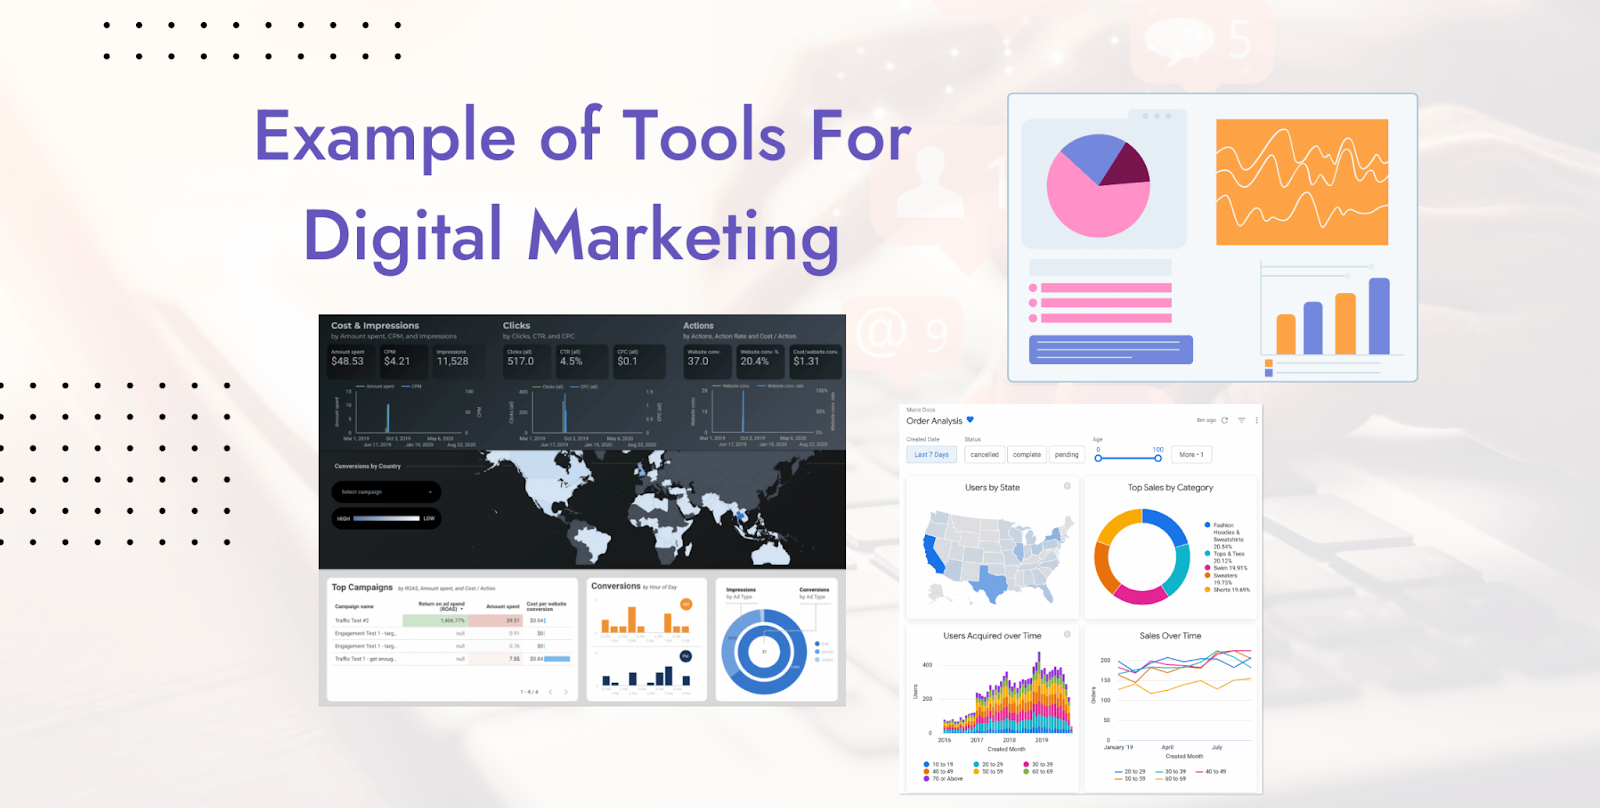
Example of Tools for B2B Digital Marketing Dashboard:
Here are some examples of tools you can explore while making your own B2B marketing dashboard.
Google Data Studio:
Google Data Studio offers a valuable solution for marketers seeking to transform the intricate data gathered within the Google suite into visually appealing graphics. Particularly beneficial for B2B marketers aiming to create
Google Adwords or marketing analysis dashboards, this tool boasts an accessible learning curve and streamlines the importation of data from platforms like Google Sheets.
Numerous reviewers have highlighted the impressive graphics, making it an excellent option for dazzling clients during presentations and maximizing the impact of their data.
Looker:
Looker is designed with a focus on speed and efficiency, catering to the needs of digital marketers, product managers, and marketing managers dealing with substantial volumes of data.
It proves particularly beneficial for marketers aiming to leverage a wide range of data sets, spanning from marketing analytics to sales dashboards.
The seamless integration with AdWords campaigns makes Looker an excellent choice for monitoring and managing ad campaign performance metrics.
Its impressive responsiveness, especially when handling large data sets, and enhanced speed contribute to increased productivity for teams and a more streamlined workflow.
Datapine:
Datapine employs artificial intelligence and machine learning to craft an optimal dashboard tailored for showcasing marketing data. Targeted at managers and data scientists, it aids in charting and monitoring Key Performance Indicators (KPIs) to drive new business growth, making it an excellent choice for a marketing ROI dashboard, SEO dashboard, and PPC dashboard.
A notable attribute of this dashboard software is its versatility, adapting seamlessly to various data needs like marketing analytics, social media reports, and CRM data. For more proficient Datapine users, there's a dedicated SQL feature, providing an advanced level of access.
A Head of Sales user expressed satisfaction with Datapine's drag-and-drop feature, enabling on-the-fly visualization of crucial sales KPIs, including backlink monitoring.
Conclusion:
In short, a strong B2B digital marketing dashboard is vital in today's competitive landscape, with an expected spending of over $7.4 billion in 2023.
These dashboards, whether internal or external, serve as centralized hubs for analyzing key data sources. Essential elements and metrics provide a comprehensive view of digital marketing performance.
Creating an effective dashboard involves strategic planning, including identifying industry-specific KPIs, choosing optimal design elements, and selecting suitable dashboard software.
Tools like Google Data Studio, Looker, and Datapine offer efficient solutions for transforming complex data into visually appealing graphics.
Investing in an efficient B2B digital marketing dashboard is crucial for making informed decisions and driving business growth in the dynamic digital marketing landscape.
Do you like what you read? Learn more about Digital Analytics on our blog here.