Google Analytics can give you meaningful insights into the performance of your website. For every marketer, this platform has become an important tool for data analysis.
It can show you where you need to improve or optimize your website to get better engagement and to understand your audience better by being informed about buyer personas and behaviors.
Since every business has different goals, you need to ensure that you are not missing out on any important data from different reports by tracking metrics relevant to your business goals.
However, analyzing data can become quite challenging at times.
Multiple reports in Google Analytics analyze various aspects of your website and measure the success of your marketing efforts. Some of the reports are more important to be monitored than others and it can become confusing which report to analyze first.
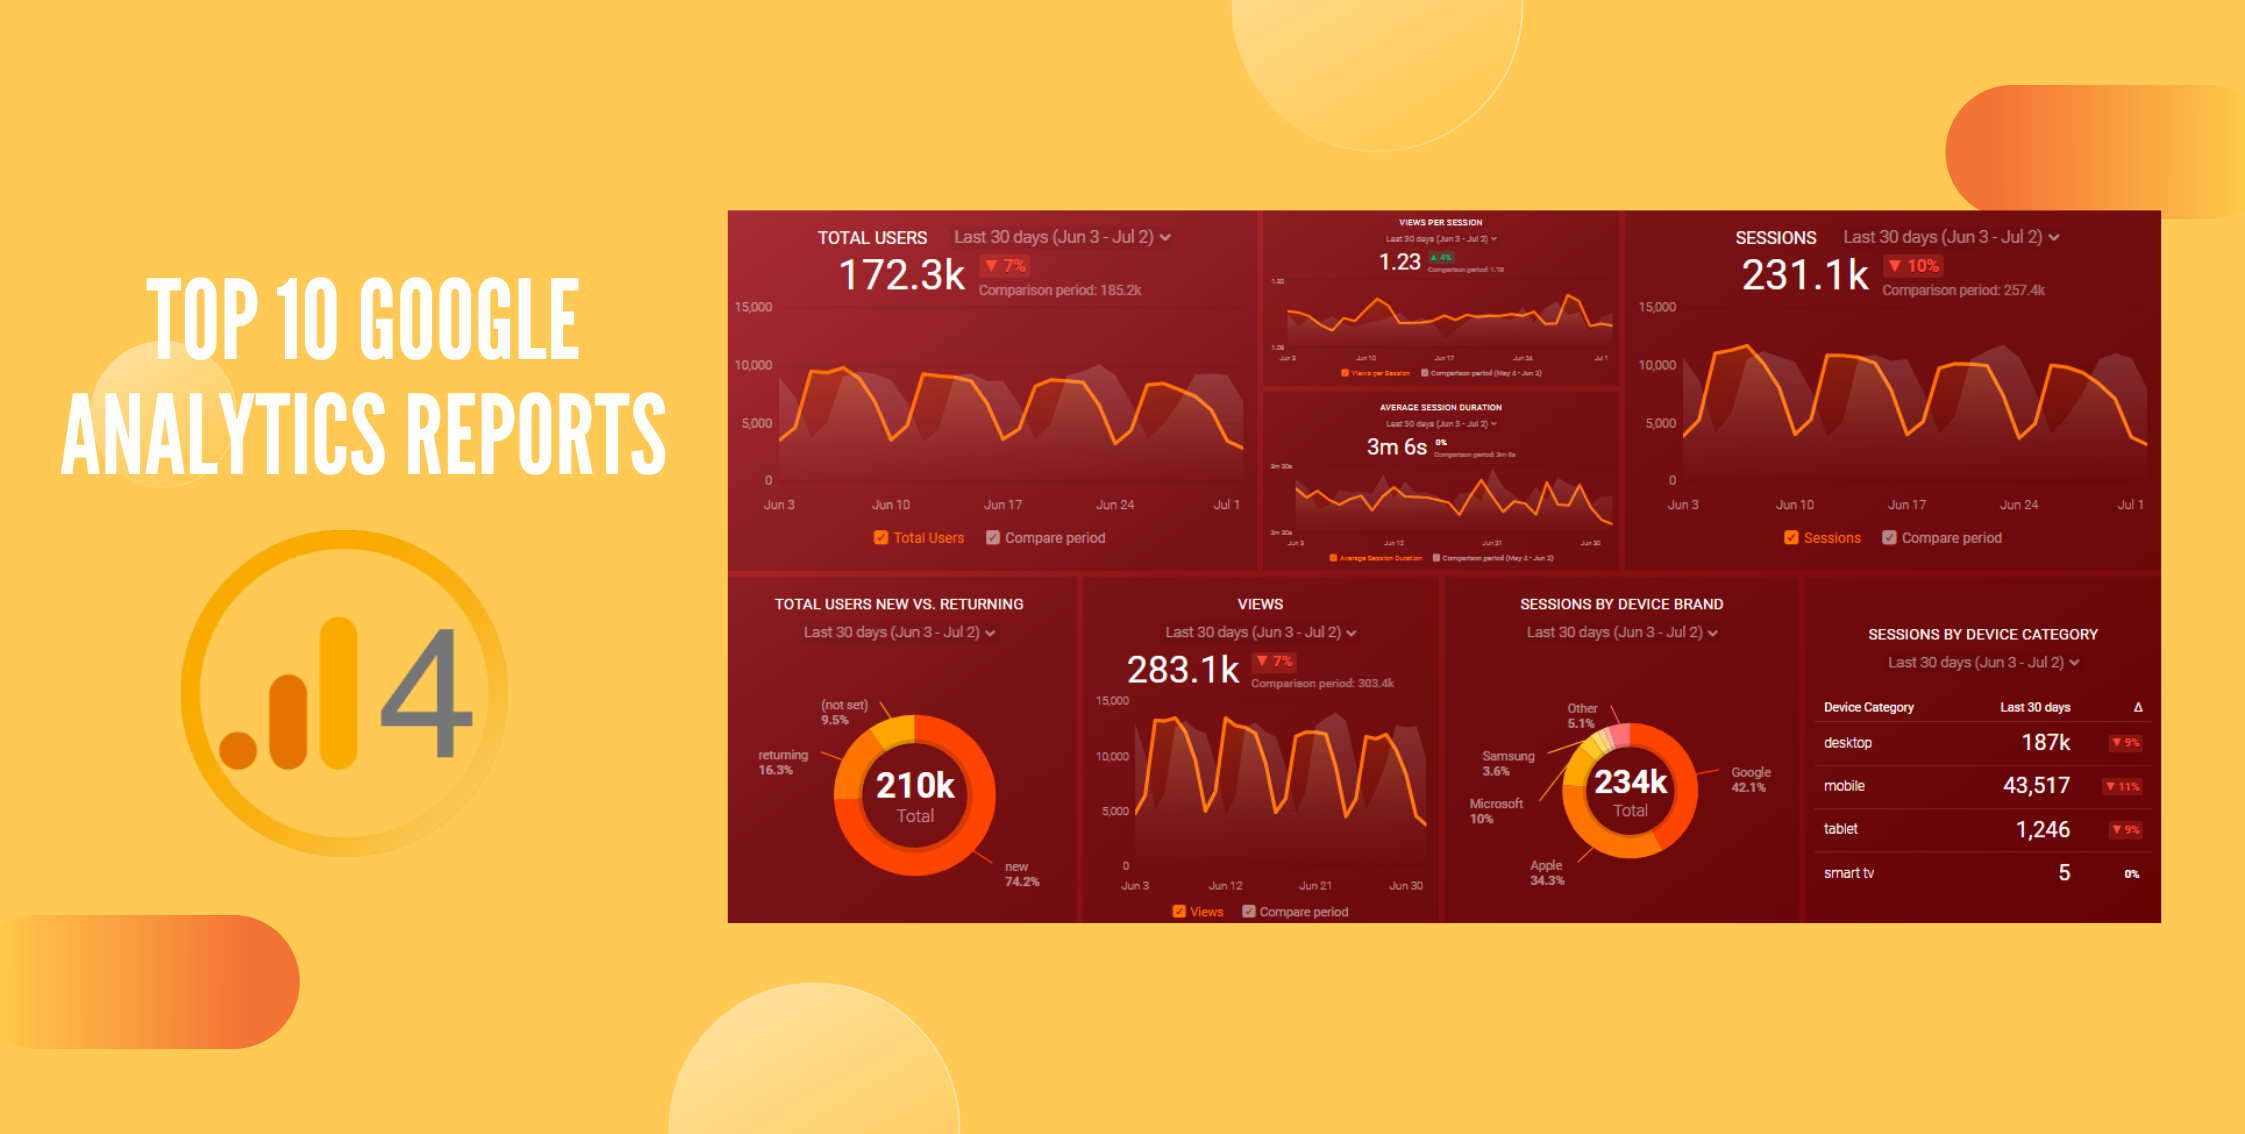
In this article, we will discuss some important Google Analytics reports that should be a part of your data analysis. Let’s take a look at the top 10 Google Analytics reports that you need to monitor to make the best data-driven decisions.
Acquisition Overview - A Quick Insight into Your Traffic
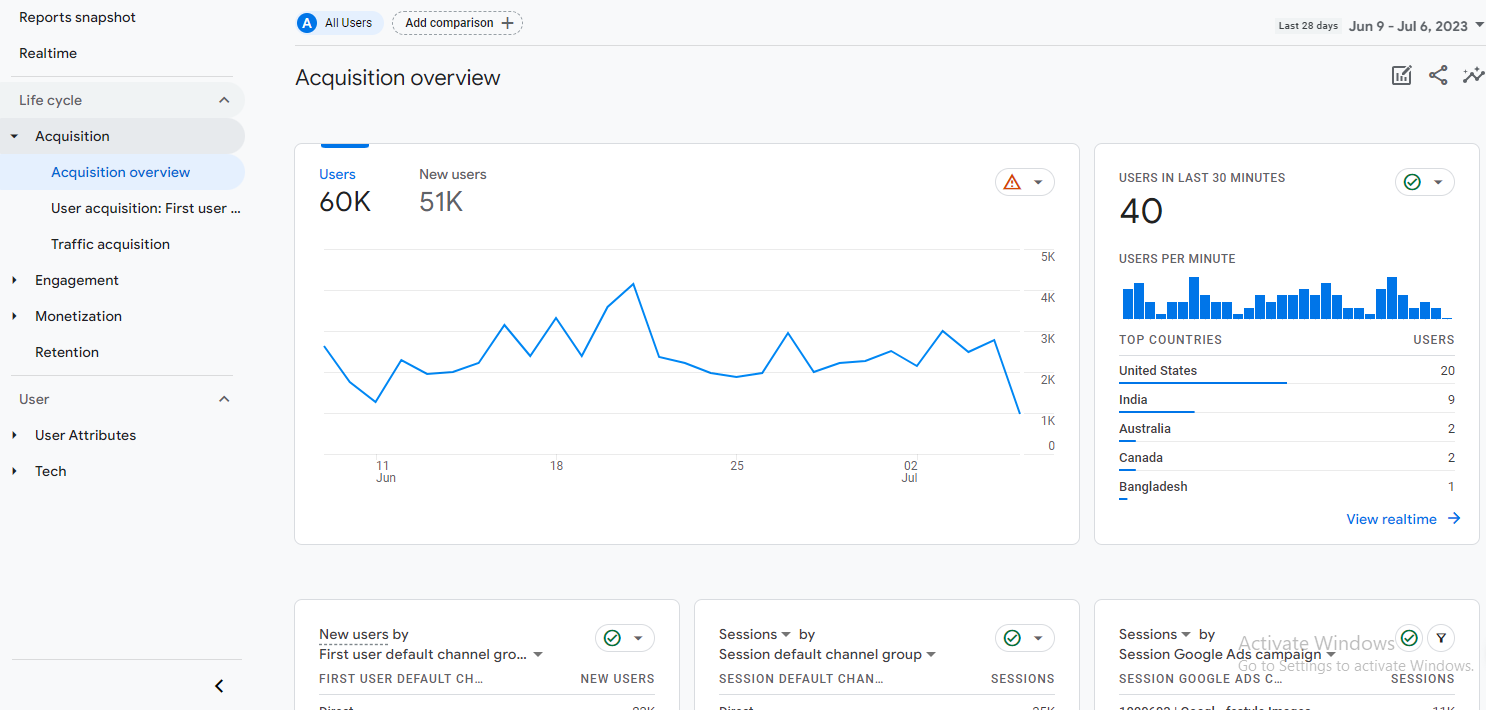
You can start your analysis with an Acquisition that gives a quick overview of your best source of traffic. In this report, you will see a pie chart that gives you a percentage breakdown of channels from which your traffic is coming to your website.
It shows whether your visitors are coming from Organic Search, Referrals, Direct Channels, Paid Search, Social Media, or some other source. This is an important section that determines if any marketing campaign you have launched is improperly functioning.
For example:
If you are running paid ads for your products or service, you can find out what percentage of users these paid ads are sending to your website.
Channels - Which channels are contributing to your traffic and conversions?
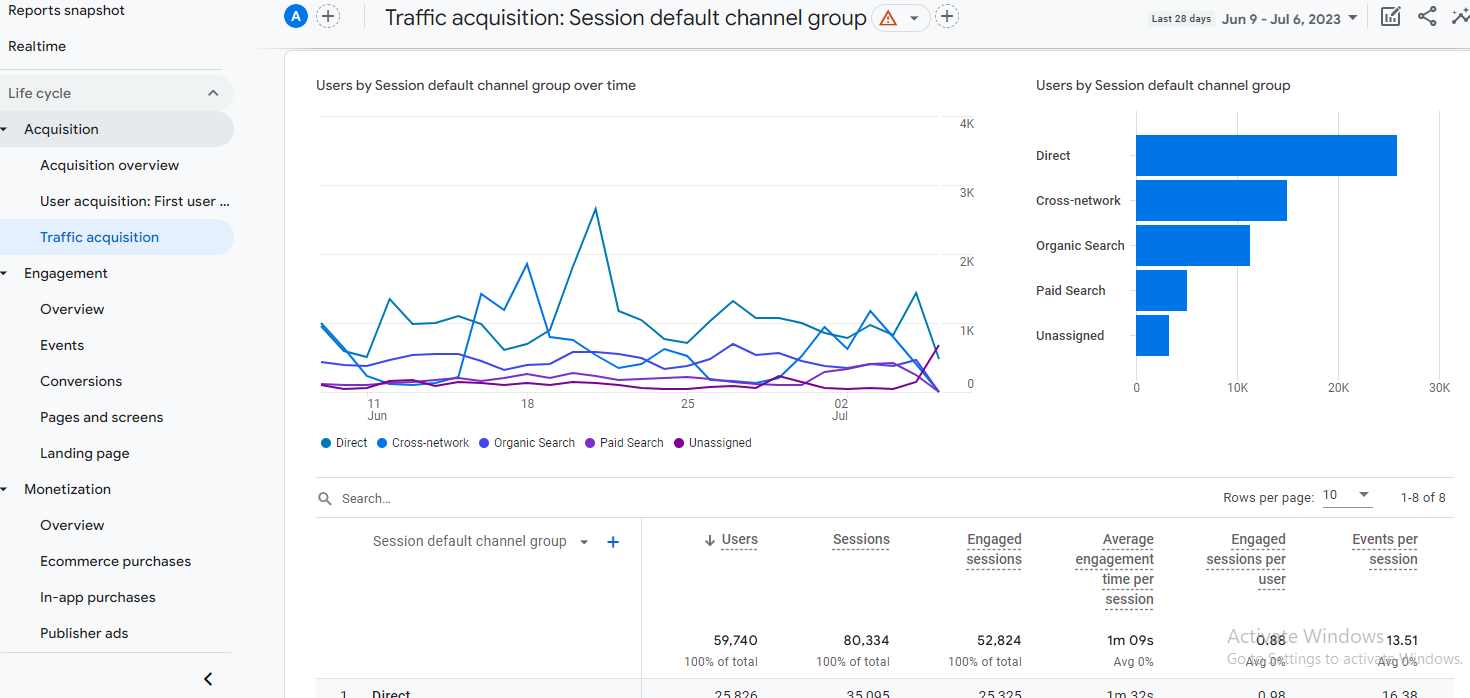
You can explore “Traffic Acquisition” to identify the different “Channels” through which your users are being directed to your website to get a more detailed view of the acquisition report.
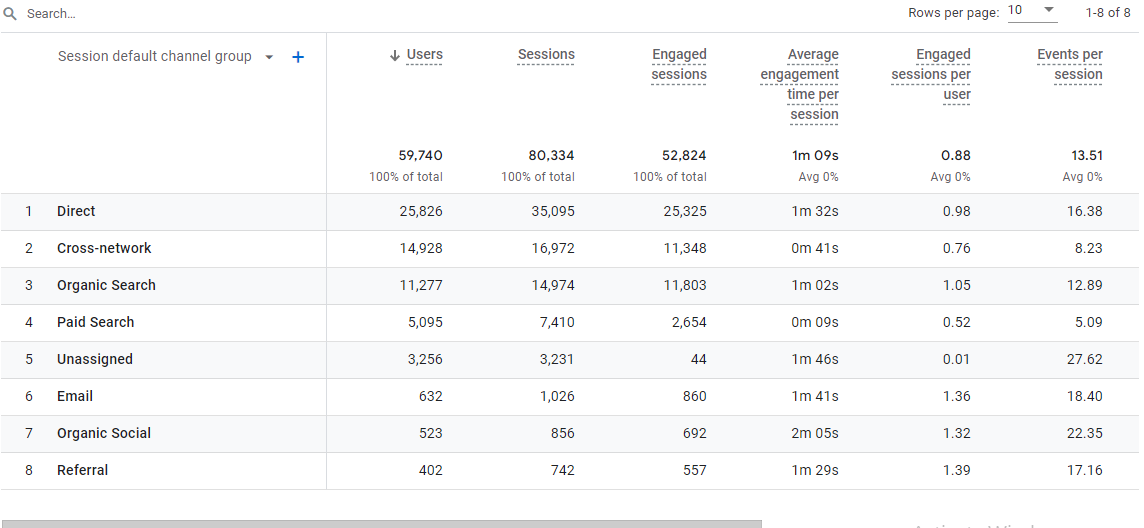
Here, you can see the sessions of all the actual users and new users that each channel has brought.
With Bounce Rate and Average Session Duration, you can track the engagement of these users after they come to your website. A high bounce rate means that users are leaving the page without interacting.
This section will also show you the number of conversions each channel has contributed to getting. This can also encourage you to optimize your website if you are not getting enough traffic as expected from organic search.
All these insights are relevant to help you track the effectiveness of your paid and organic efforts.
Audience Overview - Which channels are effective in driving user growth?
The audience overview will give you a bird’s eye view of the audience coming to your website and how they are interacting. It will give you a graphical representation to show you the flow of users visiting your website over a certain period.
Below the graph, you will be able to see:
- Total number of users
- Sessions
- Engaged sessions
- Average engagement time per session
- Events per session
- Engagement Rate
- Conversions
|
Tip: Select other metrics you want to compare it with like bounce rate or session duration to get a better understanding of your audience’s behavior. |
This report is useful as it can give you a glance at the users and their engagement with your website. When you scroll down you will have access to certain demographic and mobile information to review.
The best part about this report is that it consists of important snippets of information from other reports in one place.
Demographics & Interests - What Segments Should You Target?
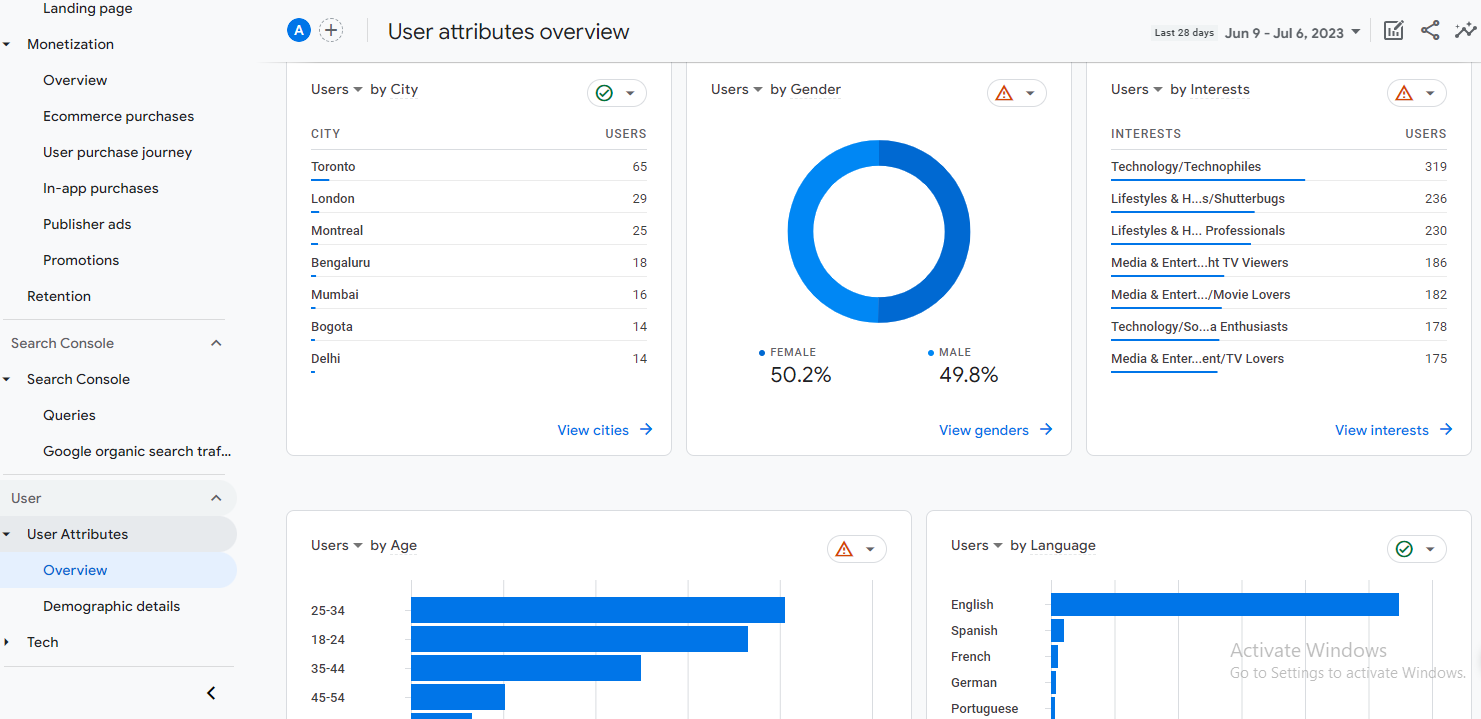
Demographics reports provide data on the age and gender of your users. Interests report shows the interests of your audience like online travel and purchasing activities. These reports together give you valuable insights into who your audience is.
Through this information, you can create content, advertising, and marketing campaigns specifically tailored for your targeted segment.
Identifying the demographics and interests of potentially valuable customers is useful in targeting campaigns as well as selecting audiences for remarketing campaigns.
For example:
If you have an eCommerce website, you can determine user groups that have high conversion rates. Content-focused sites can track users with higher engagement, through metrics like session duration or pageviews.
Both these reports include engagement and conversion metrics that will help you build a complete image of your high-value customers.
Location - Are You Targeting The Right Geographical Locations?
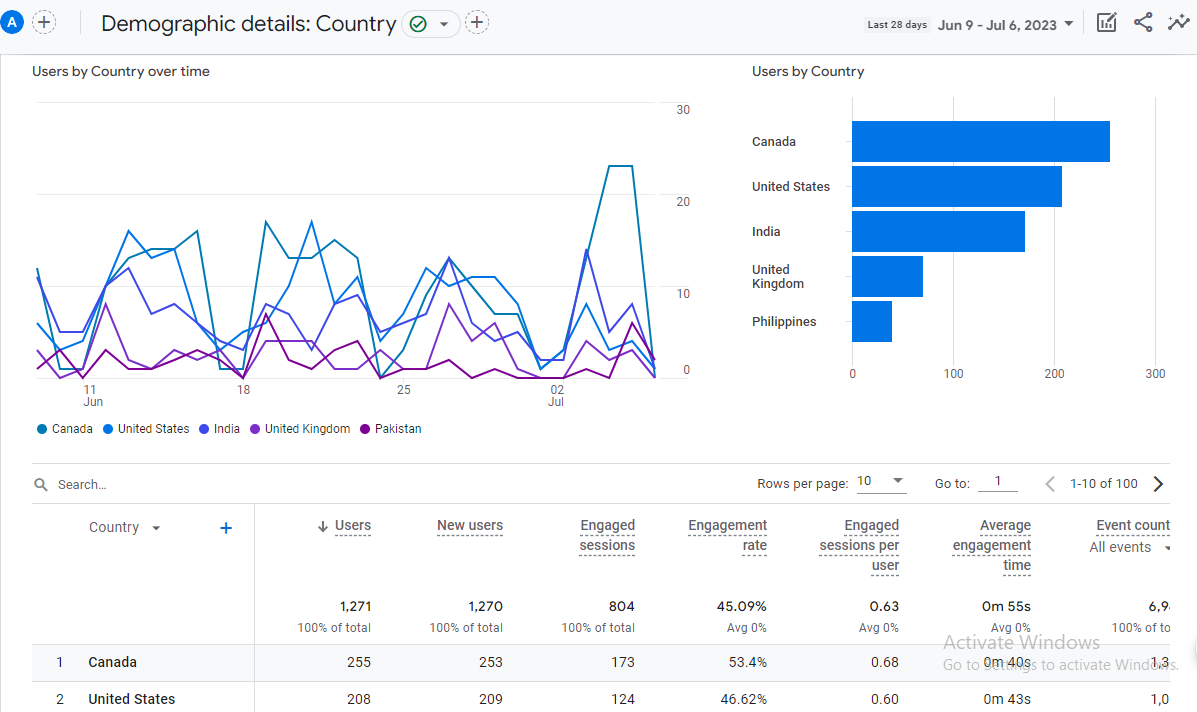
You can view location reports under the “Demographic Details” tab present within the “User Attributes”.
The location report shows you the areas where your users come from. It is important to know that you are getting users from locations that you are targeting for any marketing or advertising campaigns.
The most important regions are the ones where you provide your products or services. Along with your target area, it is good to know if users from other regions exhibit interest in your business.
This is different for each business as some businesses might provide products or services in multiple regions, while others are just based in one region. Either way, it is good to keep monitoring this report.
Mobile - What Devices are Used by Your Audience?
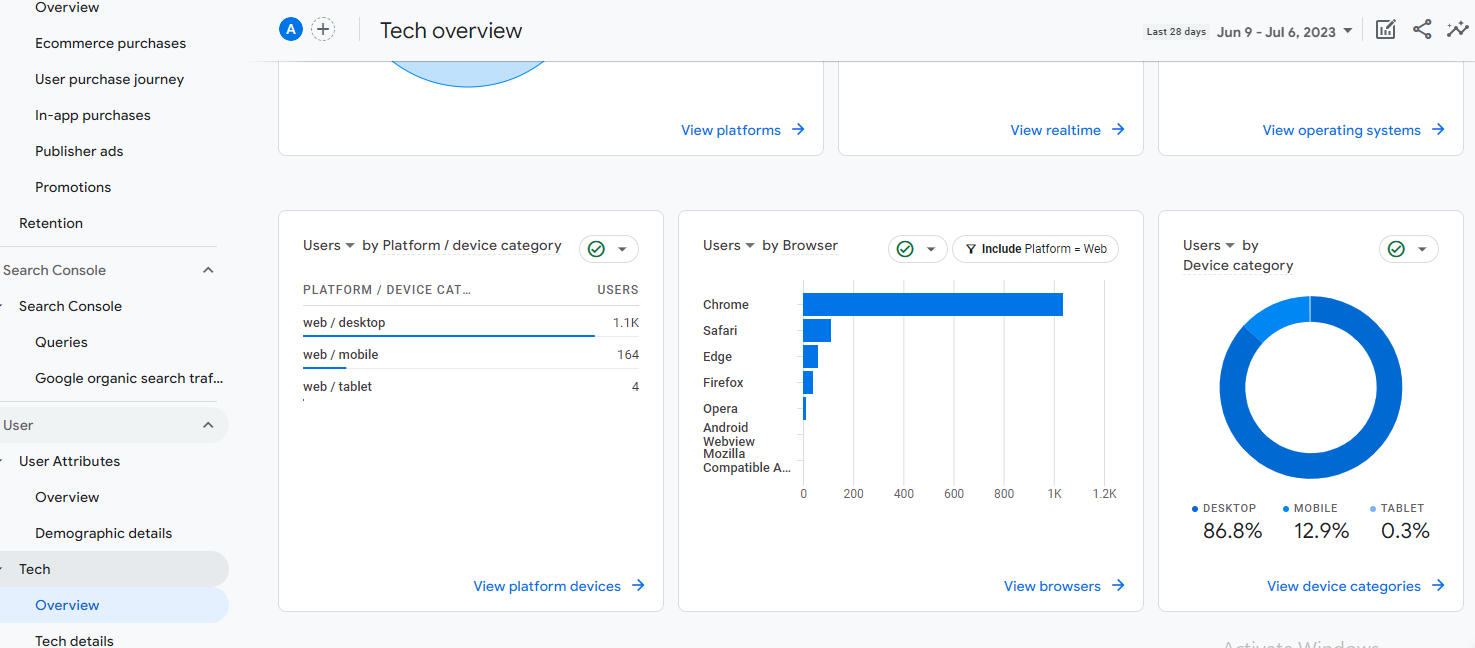
Your customers are likely to use more than one device to access your website. Mobile devices are more convenient as people can look for information quickly. In a mobile report, you can see the statistics of various devices like desktops, mobiles, and tablets that your audience uses.
You can see which device the majority of your audience is using to visit your website as well as which device has the most conversions. This information is extremely valuable when it comes to user experience. Your website must be user-friendly not only for desktop but also for mobile.
If a good number of users are also using mobile to access your site, then you need to improve your user experience for mobile devices.
Moreover, if you are running paid ads some users might also click on your ads from their mobiles; hence you need to make sure that your ads are optimized for it.
Landing Pages - Are Your Landing Pages Converting Users?
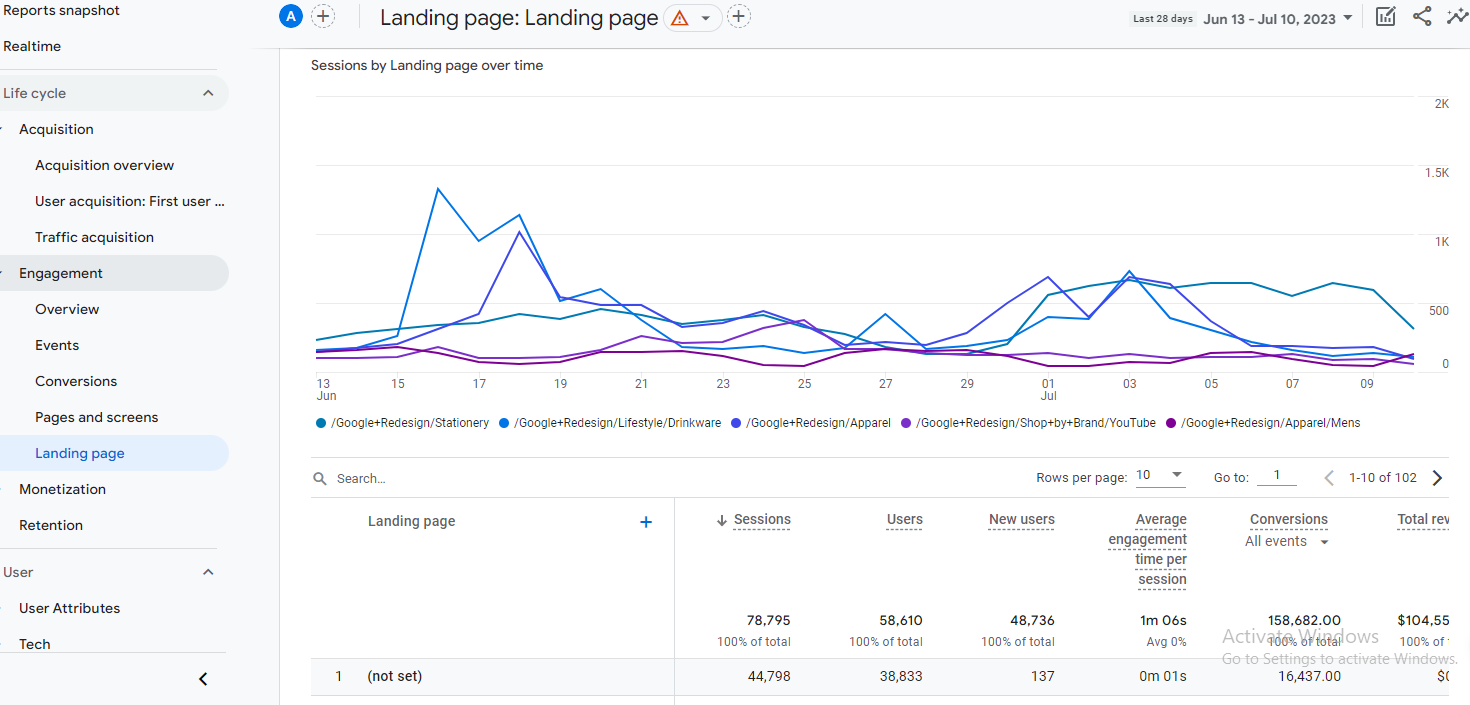
Landing pages are important aspects of your website because users enter your website through these pages. By clicking on your paid ads, users will be sent to the landing page where they are likely to convert.
You can locate this landing page report in the “Site Content” category under “Behavior”.
One important metric that you would want to look at here is the bounce rate. Review the landing pages that have a high bounce rate. This means that users are leaving those pages without any further interactions.
You need to ensure that the important pages where you want users to convert do not have a high bounce rate. If it does, there might be multiple reasons why users are not taking any action. Maybe the page is slow, the links are broken, or it's not engaging enough.
Create a great user experience on these pages for your users that might help encourage them to interact and convert. Monitor this report frequently to get insights into the performance of your landing pages.
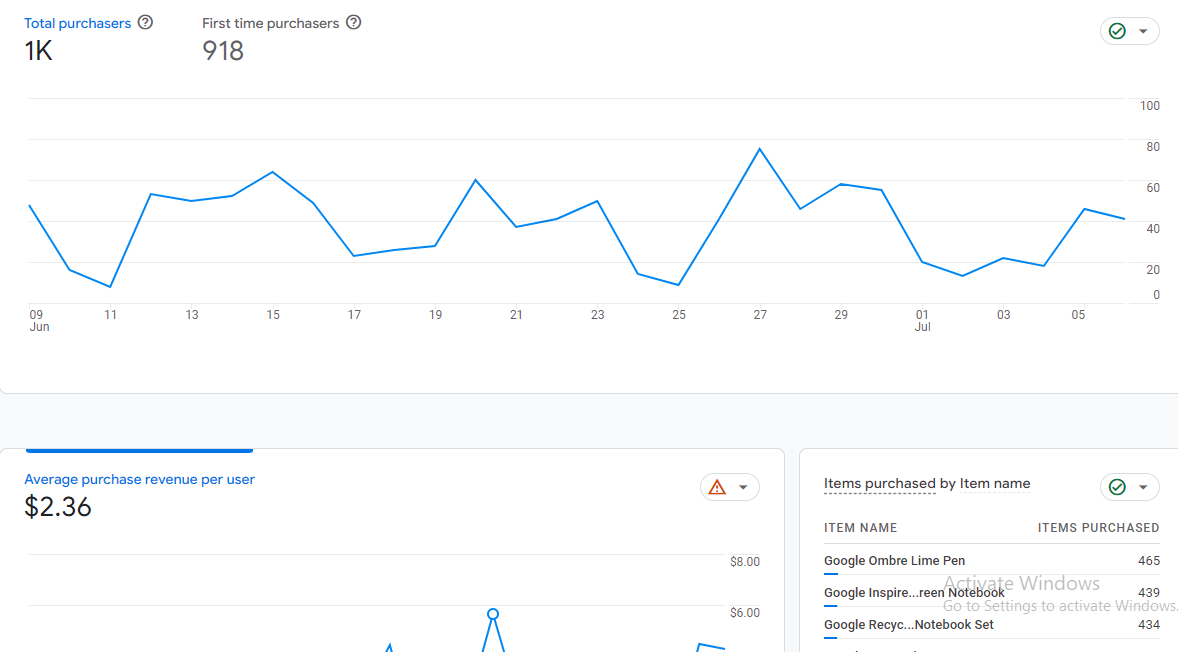
E-Commerce Reports - What is Your E-Commerce Performance?
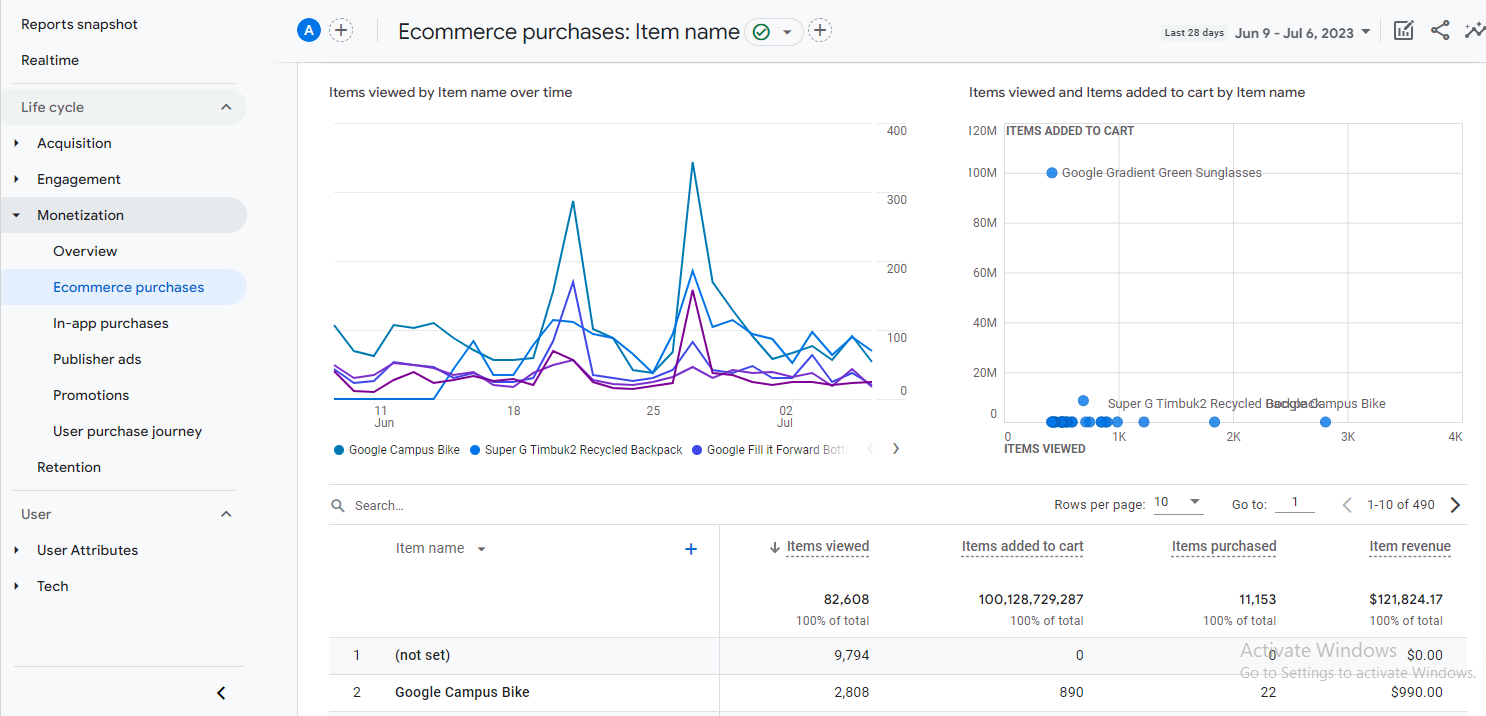
If you have online stores then e-commerce reports can provide you with valuable insights into their performance. These reports can help you track the key metrics you need to measure your e-commerce activities.
The analysis of e-commerce reports can help you understand customer purchasing behavior, key revenue generation metrics, and product performance. They provide important data on key performance metrics such as conversion rate, average order value, and total revenue.
It also helps you analyze sales performance based on different product dimensions such as product categories or marketing channels. This information can provide insights into trends, optimize your product offerings, and refine your marketing strategies.
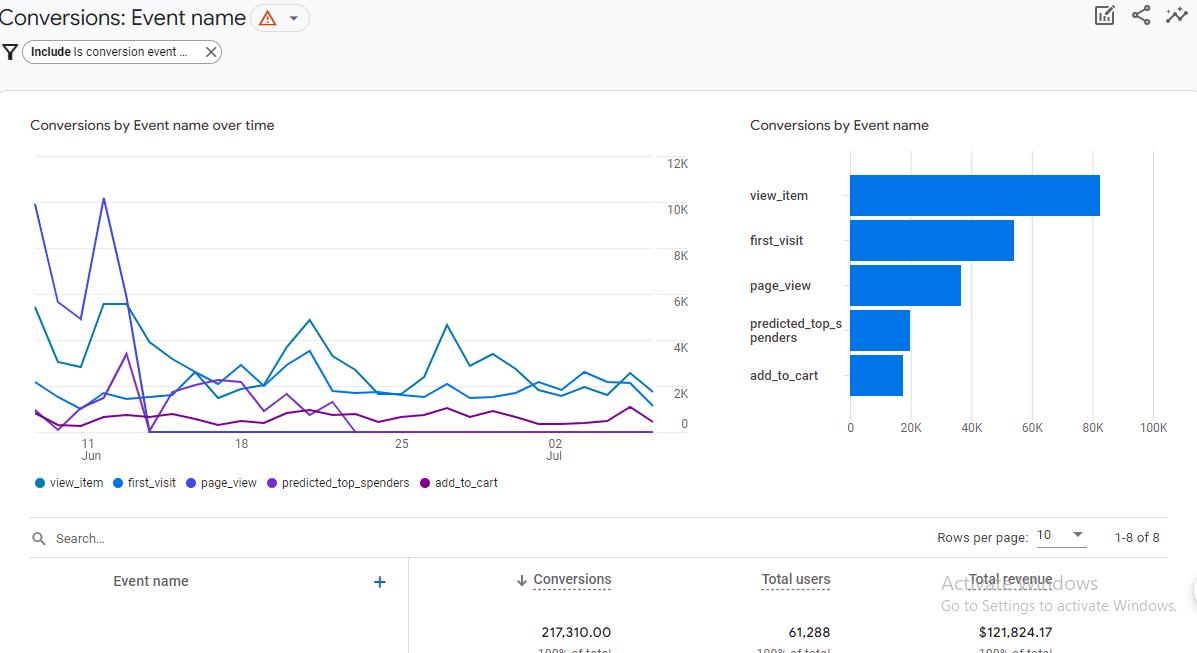
Campaign Reports - Are Your Marketing Initiatives Working?
Campaign reports can help you measure the performance and evaluate the effectiveness of your marketing campaigns. You can get valuable insights about your email campaigns, social media campaigns, or paid advertising.
You can track your different marketing initiatives by evaluating key metrics like click-through rates, conversions, and return on investment (ROI).
These reports also allow you to segment specific parameters of your campaigns such as categorizing based on source, medium, or campaign name to gain a more refined understanding of their performance.
The analysis of campaign reports can help identify the most successful marketing channels, optimize your budget allocation, and make data-driven decisions that can make your marketing efforts more effective.
Segment and Customize Reports - Filter Out Relevant Data
We understand that you might be interested in the various aspects of different reports for your specific marketing campaigns. Therefore, Google Analytics offers advanced data analysis capabilities that allow you to customize and segment your reports to gain deeper insights.
Report customization allows you to maintain focus on your business-specific dimensions and metrics.
You can segment your data into meaningful subsets comprising demographics, behavior, or marketing channels that can help you better understand the differences in audience interactions with your website or app, and how customer behaviors and preferences may vary.
You can discover hidden patterns, identify opportunities for optimization, and make informed decisions through report customization to refine your website's performance and user experience.
The “Top Conversion Paths” report shows you the path your users took to convert until they made a purchase. “Time Lag” and “Path length” reports show you the time it took for those users to ultimately convert.
Final Thoughts
Google Analytics is a powerful data analysis platform that offers several detailed reports that yield valuable insights into your website performance and user behavior. Marketers can leverage these reports to make informed decisions and optimize their marketing campaigns.
Acquisition Overview, Channels, and Audience Overview are reports that can help understand audience behavior and engagement patterns by providing comprehensive views of traffic sources, user engagement, and demographic information.
The customization and segmentation tool allows you to conduct deeper analyses personalized to your specific business goals. Moreover, the Demographics & Interests reports highlight important user characteristics that can help marketers tailor targeted campaigns.
Furthermore, Location reports ensure the effectiveness of geo-targeted campaigns, while Mobile reports highlight the trends in digital campaigns. The Landing Page reports help to identify and optimize the user experience and increase conversions.
Finally, E-commerce and Campaign reports offer crucial metrics about sales performance and campaign effectiveness.
Google Analytics reports can be leveraged by marketers to uncover actionable insights, refine strategies, and enhance overall website performance.
To understand how you can further benefit from GA4 and its advanced capabilities, you can integrate it with BigQuery to take leverage from the advantages of their connection.
Found this helpful? Find more interesting articles from our blog.