
Developing and releasing a mobile app is just the first step in the long journey to delivering a top performing mobile app. Many users anticipate the release of a new app but are often left disappointed as expectations are unmet. The app market is saturated with products that fail to meet user expectations due to a lack of value, poor usability, flawed design, and many other common pitfalls. To avoid these oversights, it's imperative to measure in-app analytics that will reveal patterns of user behavior so you can take actionable steps to optimize the overall user experience.

Measuring the right mobile app metrics will help you determine the following:
- Overall app functionality
- User wants, needs, and pain points
- User retention and engagement patterns
- How you’re meeting your overall business goals
Key performance metrics will help you analyze the success of your app that goes far beyond vanity metrics, such as the number of downloads. While the number of downloads and installations may gauge an app’s popularity in the market, it doesn’t offer insight to the overall business success of the app. This post will highlight the key mobile app metrics you should be measuring in order to take actionable steps towards meeting your business goals.
App Functionality Metrics
A great design and user experience will not matter if the app’s performance is inadequate. There’s often a direct correlation between a decrease in users and poor performance. If your app lacks proper functionality, your users will abandon the app without hesitation. Every time your app crashes, lags, or has slow load times, all your other mobile app metrics will be affected as a result. For this reason, it’s important to first track both front-end and back-end functionality to get a thorough understanding of how well your app is performing.
Front-end metrics you will need to examine include:
- Application response time
- Screen rendering times
- Device compatibility
- UI response
- App crashes
Examples of back-end performance metrics include:
- Server response time
- Time to first byte
- Number of HTTP calls
- TCP connection times
Justifiably, performance issues are detrimental to the overall success of any app as they aggravate users, diminishing the user experience. Tracking your app’s performance metrics can help you understand the technical barriers that are damaging the user experience and causing users to drop-off. There are a number of tools that you can use to track performance metrics such as Crashlytics, Google Analytics, and Xcode.
Without properly tracking app functionality, you won't be able to gather accurate data for monitoring in-app user behavior.
User Information Metrics
Tracking user data is fundamental to establishing deeper engagement. Knowing your user base will also help you understand the monetization behavior of users so that you can monitor usage, conversions, and ad click-throughs.
1. User Acquisition
User acquisition represents the number of users who download and install your app from a certain location, organic search, word-of-mouth, paid campaigns, in-app referrals, etc. For tracking user behavior and retention, later on, you’ll need to properly track user acquisition to use as a benchmark.
2. Daily Active Users (DAUs)
The daily active user is a general metric that reveals the number of users that return on a daily basis. This metric is particularly important if your revenue model depends on advertising for which a large user base is required in order to be successful.

3. Device Metrics
Apps are used on a wide variety of devices so you need to know how and where your primary user base is consuming your app and on what devices (smartphones, tablets, etc.). Determining this will help you focus your efforts so you can optimize your app for each device.
4. User Location
Where are your users consuming your app? This data will enable you to identify issues faster. For example, if you have an app that targets a broader geography but only gets local traction, you can start to analyze why this is.
5. Screenflow or User Journey Mapping
Screenflow tracks the movement between screens, and total number of visits, mapping typical user interactions within your app. Examining screenflows will allow you to look at a particular screen and see what actions users took and where they went after they left the screen. This will define user pain points, conversion barriers, and drop-off areas.

Gathering user data can be beneficial for a myriad of reasons, but the greatest benefit of all is that it will inform the evolution of your mobile app so that the user experience will be personalized. You’ll be able to determine what features people use the most, their purpose for using the app, and so on, which should drive all product decisions during the development process.
User Engagement Metrics
1. Session Duration
Session duration is the time period between when the app is opened to when a user exits out. These metrics reveal how much time your users spend in your app per session. The more engaged your users are, the longer their session length will be. You can leverage user segmentation to reveal which users are spending the most time in your app and why.
Measuring session durations will reveal areas for improvement to boost revenue potential. Tracking this metric for a retail app, for example, will uncover user journey gaps such as a prolonged mobile checkout. If you’re seeing that users are abandoning their cart while checking out, you might want to reduce the steps within the checkout process. This will help you make improvements, which will inevitably increase your conversion rates.
2. Session Interval
Session interval is the time between the user’s first session and their next, highlighting the frequency of which the app is opened. Examining the time between sessions can help you optimize the user experience by prompting regular app use, increasing the number of daily active users. This metric will reveal why your users are using your app infrequently as well as show areas of value for what’s causing them to return and why this is.
3. “Stickiness” (Retention & Engagement)
Many apps that are downloaded are never used more than once. Two main reasons for this are a) because of the lack of value the app provides users and b) an overall poor user experience. Both of these reasons contribute to unmet user expectations. Retention is measured as the percentage of users who return to your app based on the date of their first visit.
Tracking retention allows you to determine what features users want and what is unnecessary. Building long-term retention is essential to improve conversion rates. In order to increase LTV and revenue, you must establish a highly-engaged and immersed user base that will remain loyal to your app and brand as a whole.
Revenue Metrics
1. Acquisition Cost
Mentioned earlier, examining your user acquisition metrics is a crucial step to determine where users are coming from. But it’s just as important to analyze how much each user costs to acquire. Users will expectantly discover your app through a wide variety of channels, including organic search through the App Store, paid campaigns, and in-app referrals to name a few. The number of app downloads from a given source is important, but not as important as the value users drive when they’re absorbed in the app experience.
2. Abandonment Rate
Abandonment rate is the ratio of in-app transactions (such as a mobile checkout) compared to transactions that have been aborted. Transactions may be abandoned due to a wide variety of reasons, such as poor app performance or user experience. This will uncover gaps and pain points users experience when they navigate through the app.
3. Lifetime Value (LTV)
Lifetime value is a key revenue metric, representing the value of the app and how much each app user is worth during their lifetime. LTV can illustrate growth over time for different user segments, and signals how much more you should spend towards acquisition to gain more of these users and still make a profit. This metric drives your marketing budget, however, it involves more than the average revenue per user (ARPU). You need to factor in the churn rate, the percentage of users that stop using the app, and the customer’s referral value (CRV). Ultimately, you should aim for the LTV to be greater than the customer acquisition cost (CAC).
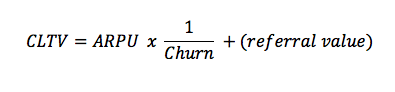
Source: Apptamin
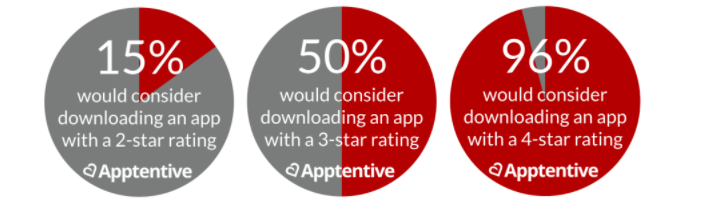
Potential Users Remain Influenced by Vanity Metrics
Whether we like it or not, we live in a world where ratings and reviews greatly influence people's decision to purchase or download a product. When it comes to downloading an app, people heavily rely on ratings to justify their decision, which is why it's important to optimize all aspects of your mobile app to satisfy users. Further, you need to ensure that you exceed user expectations to keep them coming back, as they advance through the conversion funnel.
The overall success of your app will be significantly impacted by how people rate your product. Ensure that you acknowledge ratings and ask your users for feedback.
Adding Value to Drive Positive Results
Measuring and optimizing for the right engagement metrics is the key to retaining your users. Whether your business model is driven by in-app advertising, product purchases, or paid subscriptions, driving your revenue is fundamentally dependent on personalization and engagement. Use engagement and retention data to inspire product updates, UX redesigns, and campaigns, to boost ROI.

Delivering personalized, hyper-relevant experiences requires a deep understanding of the users themselves - rooted from data. These metrics will allow you to better understand your users so you can make data-driven decisions that will improve the overall user experience, meeting business goals.